DEMOGRAPHY
Map contents
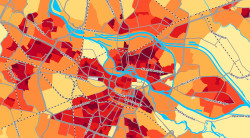
- Population density (people/km2) by census blocks
- Population count by census blocks
- Age structure by census blocks
Population data is presented for selected years from 1998 to 2025. Latest layer is turned on by default. You can switch between different years using a dedicated slider, as shown below:

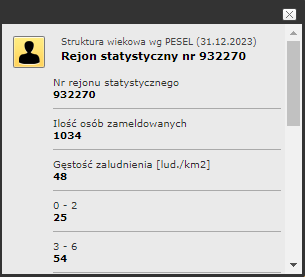
You can also identify the latest layer and view detailed information on census block.

Overall population count (as of December 31th of each year)
- 1998 - 593.966
- 1999 - 594.170
- 2000 - 594.197
- 2001 - 595.590
- 2002 - 596.169
- 2003 - 596.312
- 2004 - 598.003
- 2005 - 598.176
- 2006 - 595.719
- 2007 - 595.220
- 2008 - 594.151
- 2009 - 593.448
- 2010 - 592.835
- 2011 - 591.926
- 2012 - 591.090
- 2013 - 590.749
- 2014 - 590.905
- 2015 - 588.139
- 2016 - 588.503
- 2017 - 586.661
- 2018 - 585.195
- 2019 - 585.230
- 2020 - 583.204
- 2021 - 577.996
- 2022 - 574.556
- 2023 - 571.379
- 2024 - 567.261
- 2025 - 564.609
Data download
To download the underlaying data, go to our resources page where you can find zipped archives containing spreadsheets and shapefiles.


